Blog
v1.3.4 Update out!
Your charts just became personal! With the new v1.3.4 update, we bring to you the chart customization dialog where you can customize your graphs to look just how you want them!
Graph Plotter Team
Graph Plotter Team
2026-05-16
·
1 min read
Live preview: The chart now updates instantly as you change settings, no need to click Plot. All sidebar controls trigger a live re-render, with changes batched to prevent flickering.
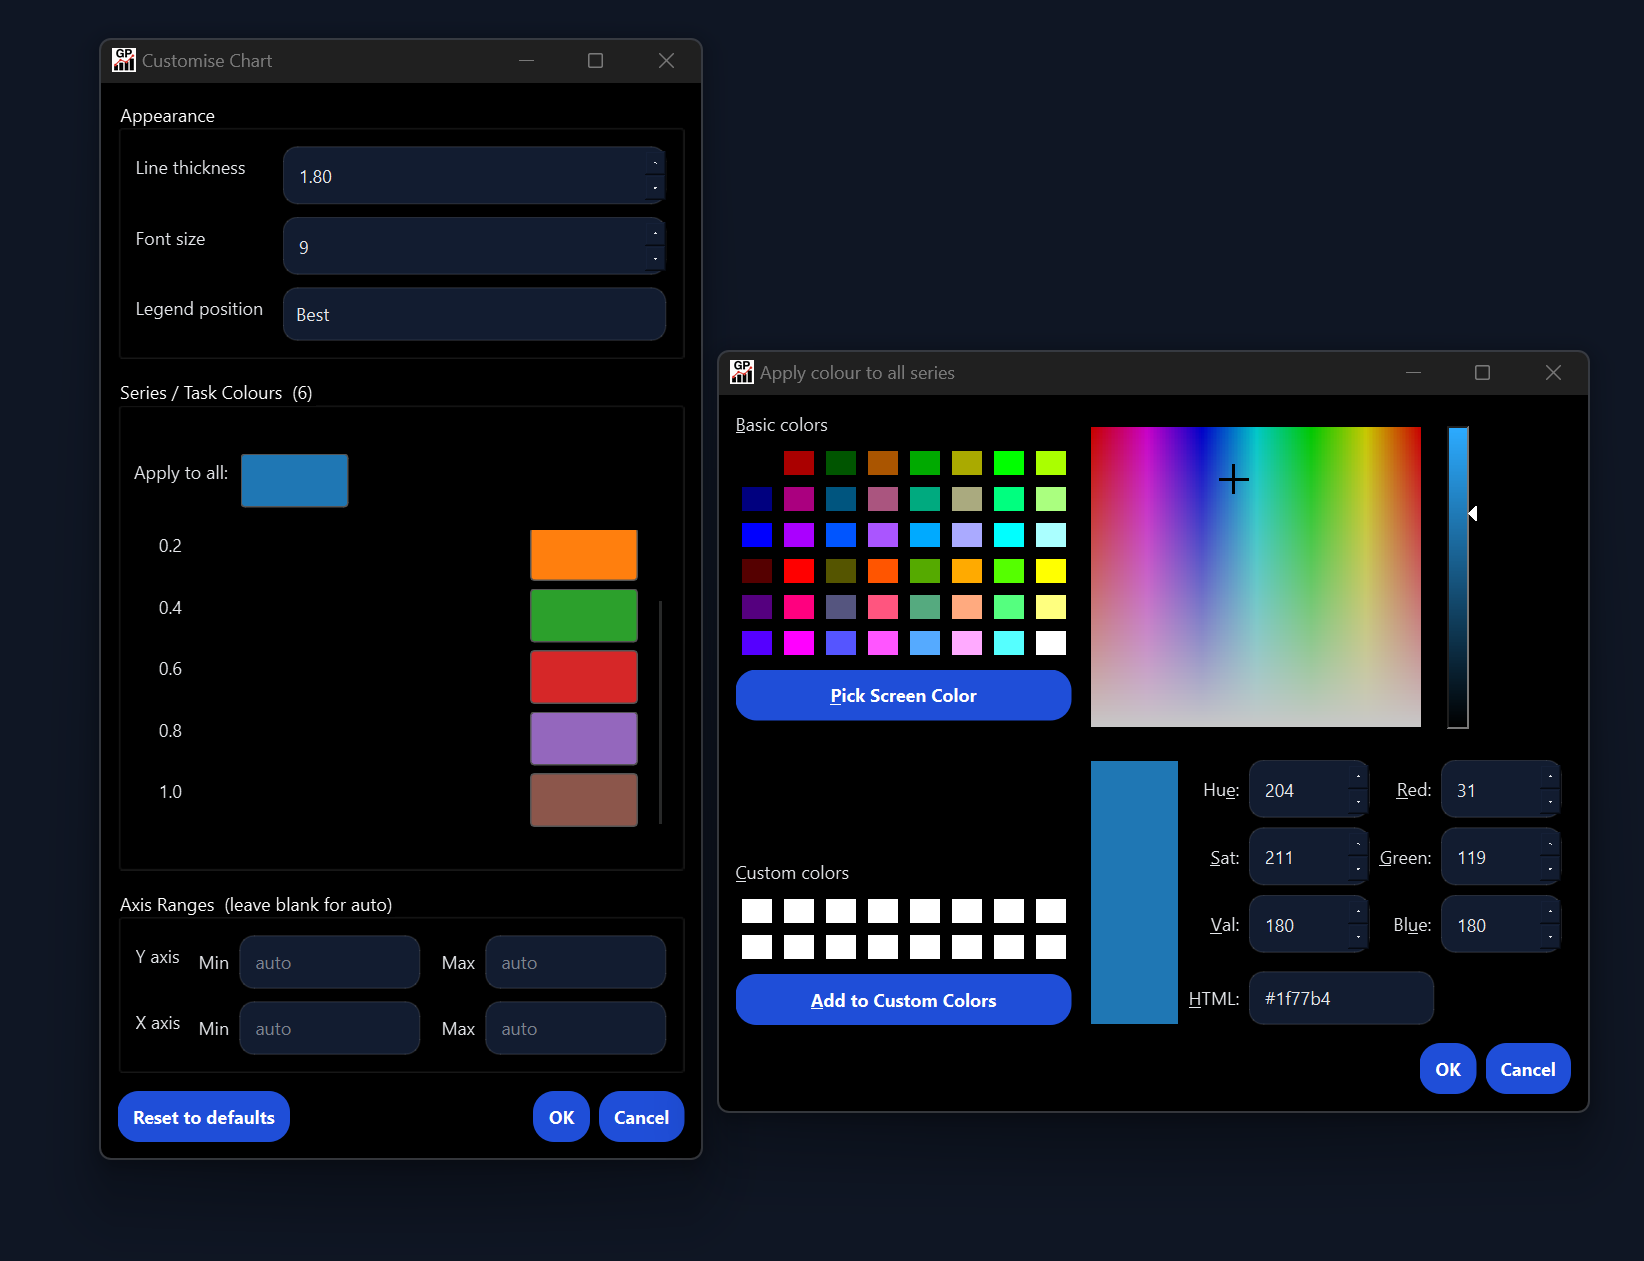
Customise Chart (new): A new dialog gives you full control over chart appearance. Set individual series colours or apply one colour to all, adjust line thickness (0.5 to 8.0), scale font size (6 to 20), choose legend position, and set manual axis ranges. Custom colours persist across re-plots and survive trendline or moving average additions.
Smart sidebar (new): The sidebar now shows only the controls relevant to the active chart type. Switching chart types hides irrelevant options and resets them so no stale settings carry into the plot.
Chart type auto-suggestion (new): The app now picks the most appropriate chart type automatically when you load a file or switch columns. Date-like columns suggest Line, two numeric columns suggest Scatter, and categorical columns suggest Bar. Pie, Gantt, Histogram, and Efficient Frontier are never auto-suggested. Selecting a chart type yourself disables auto-suggestion for that session.
Anomaly detection improvements: Anomaly markers are now hollow rings rather than filled circles, with the ring colour calculated as the RGB complement of the series colour for maximum contrast. A fallback to vivid orange applies when the series colour is close to grey. Scatter chart support has also been fixed.
Help menu: Documentation and Report a Bug now open the relevant pages in your browser.